Mapping the PyData Community

Gathering data, building maps, and the places that it can take you
I really like maps. I collect (mostly transit) maps and, when sitting down to write this blog, I quickly ran out of fingers counting all the maps up on the wall in my flat. Maps have an ability to inspire us to explore the world around us, within them containing just enough information to travel an unknown landscape whilst still leaving enough blank space to inspire the imagination. I also really like being a part of the PyData community having spent the past few years attending and later helping to organise PyData London.
PyData, for those who are unaware, is the educational/community arm of NUMFocus, an organisation that supports many open-source scientific and data science Python projects like Scipy and Pandas. PyData has groups all over the world hosting regular meetups and each PyData London meetup starts with a slide featuring this map of those communities. Odds are if you’ve been to a PyData event before it was PyData London as with 16,000 members it’s the largest PyData community in the world.
PyData UK is much more than just a mega-meetup in the capital though, in fact the UK has more PyData groups than any other country in the world with a whopping 20 groups, narrowly beating out the US where there are 19. This abundance of groups means there’s likely a PyData community near you. Meetup’s search feature has long been a bit of a joke so if you want to find your nearest PyData community (or any Meetup community for that matter) your only real option is to use the map Meetup provides. And that map has a problem.
Meetup’s Map is Terrible
Despite its flaws I’ve always found this map particularly inspiring, much like pythondeadlin.es and other similar resources, it showcases the sheer scale of the international Python community, and serves as something of an invitation to go seek out like-minded people the world over. For all that inspiration though, there's a major issue with it: it’s built and maintained by Meetup. I’ve spent a lot of time complaining about Meetup over the last few years (no hate to the folks actually building the Meetup platform, I’m sure it’s very difficult trying to get work done in the kind of environment private equity takeovers create). It's a tool I rely on heavily as a community organiser, but if we zoom in specifically on the UK position of the map we can see the issues with Meetup’s map of PyData communities.
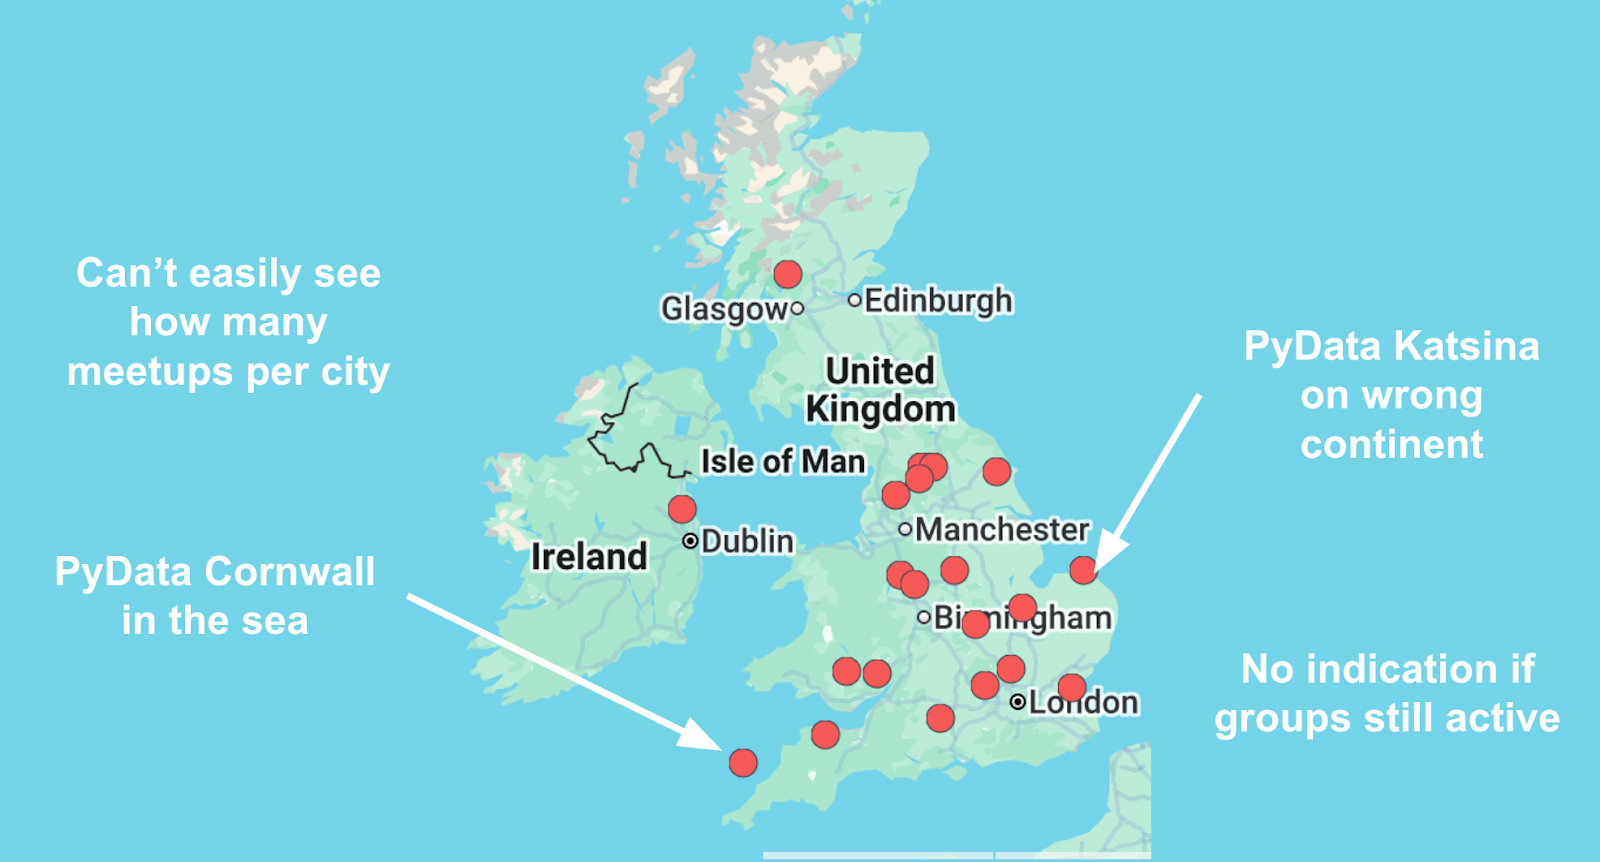
Immediately obvious is this issue of how Meetup chose to display the locations of each group with every marker sitting dozens of miles north of the group's actual location. Closer inspection reveals some more glaring issues: some groups like PyData Katsina are shown in entirely the wrong location (not just a few miles off the mark but in fact on the wrong continent), and it’s impossible to see if there is more than one group in the same city.Rather than fall back on my usual shtick of complaining about Meetup I decided to build my own improved version of this map. I was motivated to do this because of what this map, despite its flaws, inspired me to do which was to see how many UK Meetups I could actually speak at or attend: PyData London is an awesome community and the promise contained within this map is two dozen other communities of like minded people all over the UK. This particular goal required some data that was currently entirely absent from this map: which groups are actively hosting events and how do you submit a talk. I’ve previously spoken at PyData Southampton but this project would require more preparation than a friendly email to Adam Hill, so I set out to make my own maps of the PyData community that addressed the issues with the Meetup map and would provide me with the information I needed to plan my little adventure.
Making My Own Maps
Collecting Group Data
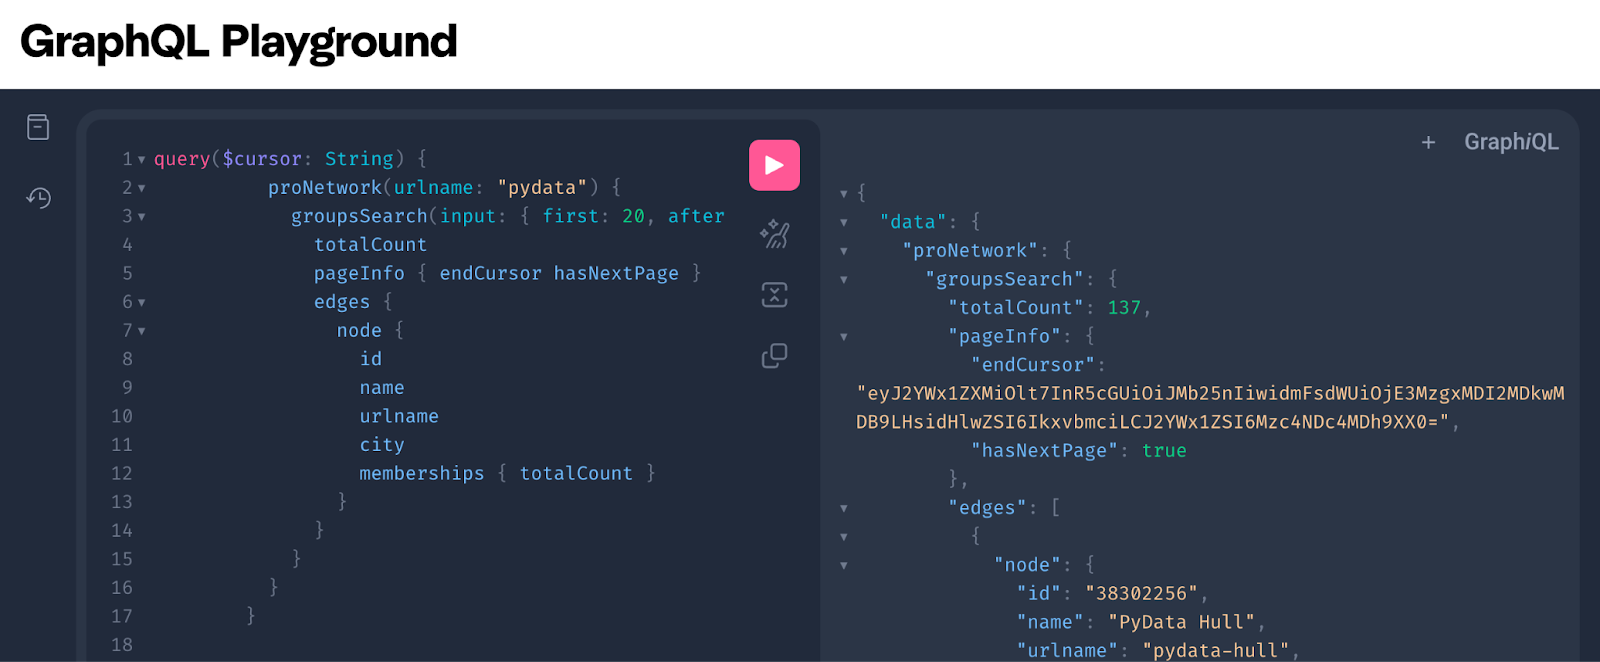
I had a couple of options for collecting the data I would need to produce my maps: use the Meetup API (which I have access to as a paid up Meetup Pro organiser), or scrape the data directly from the Meetup website (as permitted by their robots.txt). Meetup deprecated their REST API in 2025, which in turn killed off various third-party wrappers, and their docs now start with a “GraphQL good” screed explaining their decision to do this. Apart from that somewhat jarring piece of product management, the Meetup API is actually fairly robust and revisiting it, I found that for getting groups from the PyData network you could easily use a GraphQL query like:
       query($cursor: String) {
          proNetwork(urlname: "pydata") {
            groupsSearch(input: { first: 20, after: $cursor }) {
              totalCount
              pageInfo { endCursor hasNextPage }
              edges {
                node {
                  id
                  name
                  urlname
                  city
                  memberships { totalCount }
                }
              }
            }
          }
        }
Granted this requires negotiating the Oauth process and refreshing tokens periodically. I also particularly like their GraphQL Playground in the API Docs which uses your logged in Meetup account to give you access to a live GraphQL sandbox where you can experiment with queries, this is a nice touch and for me it’s a sign that there are actually engineers at Meetup who care about user experience.
Ultimately though for simplicity I opted to just scrape everything I needed for my maps work from a local copy of the group data in a Pandas dataframe. Whilst the API does make it relatively easy to request some of the data I needed, like group names and upcoming events, it doesn’t have some of the data that was crucial for building maps of active groups, namely time since last event, and total number of past events.
Scraping from Meetup brings its own challenges. The list of groups on Pro Network pages is loaded dynamically. My code for scraping from the Meetup group list is sprawling and clunky (you can check it out on GitHub here) but boils down to loading the page with PlayWright, spoofing scrolling inputs and periodically dumping the static HTML to get a complete list of all the groups in the PyData Pro Network. I also used a similar approach to scrape the past and upcoming events for each individual group so I could collect the activity data I wanted.
Data Preparation
After scraping the data some preparation was needed to make it usable for mapping. The main issue (as I previously mentioned) is that the latitude and longitude for each group is incorrect when scraped from Meetup, and the city field is also junk because for some groups it was populated wrong i.e. PyData Katsina’s city field is set to Norwich. This meant that the only “accurate” location information for groups on Meetup is the group name itself. Most PyData groups are named something like “PyData <location>” i.e. PyData London, PyData Boston etc so I was able to use string replacement to remove common phrases like “PyData” to get just the city name string. I could then geoencode the city name to return plottable co-ordinates with geopy. This worked great apart from a few notable exceptions like PyData En Español Global and PyMc Global which don’t have physical locations and some groups which ignore the naming convention entirely, I’m looking at you “Datenanalyse, Data Science und Statistik - PyData Dortmund”.
{
  "hints": {
    "PyMC Online Meetup": null,
    "PyData En Espa\u00f1ol Global.": null,
    "NEO AI - a PyData Group": "Cleveland, Ohio, USA",
    "PyData Ireland": "Dublin, Ireland",
…
I got around this by adding a list of “hints” for the geoencoder which allowed me to flag which online only groups should be ignored and create aliases for other groups where required. The only other data preparation required was a simple join of all group lists and individual group data (i.e. past event count, total members) which was easy enough with Pandas.
Bonus: Playing with the Dataset
One fun upshot of going to the effort of scraping, enriching, and preparing the PyData community data was that it allowed me to easily interrogate the data in a Marimo notebook. You can clone the repo to play around with the data yourself but here are a few insights I found particularly interesting:
Top 10 largest PyData groups by members
| Group | City | Events | Members |
|---|---|---|---|
| PyData London Meetup | London | 123 | 16,263 |
| PyData Berlin | Berlin | 138 | 9,506 |
| PyData NYC | New York | 88 | 8,041 |
| PyData Amsterdam | Amsterdam | 99 | 6,576 |
| PyData Chicago | Chicago | 134 | 6,191 |
| PyData Seattle | Bellevue | 99 | 4,199 |
| PyData Atlanta | Atlanta | 126 | 3,911 |
| PyData Manchester | Manchester | 115 | 3,866 |
| Data Engineering Pilipinas - a PyData group | Mandaluyong | 75 | 3,839 |
| PyData PDX | Portland | 106 | 1,471 |
Top 10 countries by total PyData members
| Country | Members |
|---|---|
| United States | 37,762 |
| United Kingdom | 30,283 |
| India | 26,088 |
| Deutschland | 19,409 |
| Brasil | 11,471 |
| ישראל | 9,361 |
| Canada | 8,495 |
| Nederland | 7,729 |
| Polska | 7,073 |
| Singapore | 5,767 |
Top 10 countries by total PyData groups
| Country | Groups |
|---|---|
| United Kingdom | 20 |
| United States | 19 |
| India | 8 |
| Nigeria | 7 |
| Deutschland | 6 |
| Brasil | 5 |
| España | 5 |
| Italia | 4 |
| Australia | 3 |
| Canada | 3 |
Plotting Maps
For plotting the maps I elected to use Folium. Folium has its limitations but is well suited for easily creating custom markers to make the types of maps I wanted.
Based on data scraped from www.meetup.com/pro/pydata, last updated...
The first map I plotted is this one with plain markers for each PyData and PyData affiliated group closely mimicking the existing PyData group map on meetup. The only difference is the location of groups is plotted as the geocoded name.
Making this second map was a decent chunk of the motivation for this entire project. My goal was to make it easy at a glance to spot active groups to speak at or attend, and to identify dormant or inactive groups that may require support (although I later decided to split that last part into the third map below). To that end I set up custom markers: the marker radius is scaled with the number of group members, the markers become fainter the longer it has been since the last event was scheduled, blue groups have no events scheduled, and green groups have an event scheduled. The blue / green distinction I added in later so brand new groups wouldn’t appear as faint but instead would be extremely prominent on the map, I added this feature after spotting the new PyData Hull group that was created during this project.
This final map shows groups that haven’t hosted an event in 100 days in bright red. I decided to make it because the map above by design makes groups like these almost invisible and I felt it would be useful to specifically draw attention to groups that may need support. I landed on 100 days as even mostly dormant groups that still had active organisers would have uploaded the link to last year's PyData global, which at time of writing was 77 days ago, meaning that it is likely that these groups are in desperate need of organisers or support in order to host events in future.
Publishing and Keeping Maps Up to Date
Up until this point in the project I’d been hacking away in a Marimo notebook which took up to 15 minutes to scrape the data from Meetup and produce the maps. Before I shared the maps I wanted to make sure they would stay up to date with the data available from Meetup. To this end I created a Python script that would spit out the maps as static HTML that I could serve from GitHub pages and then set up a GitHub action to run the script every 24 hours. I also added some basic caching to handle edge cases when the scraping timed out. I also went back and updated the maps at this point to allow specific zooms and views to be saved in the URL to make it easy to create country or region specific maps.
I had a lot of fun with this project and these maps did end up being useful for thinking about a potential tour of UK PyData groups, even if it did mostly reveal the scale of that challenge. From a technical perspective I wouldn’t use Folium if I were to do this again because of limited options for maps in different languages, ideally I would like to create localised views of maps for each PyData group.As part of this project I presented my work as a lightning talk at PyData London, and subsequently the group used my map to replace the existing one (as it turned out I wasn’t the only one annoyed by the locations being wrong on the original meetup map) which was really cool, it’s always nice to see tools you build getting adopted.
I’m proud to be a part of the international PyData community, but this project has made me especially proud to be part of the UK PyData community: I’ve learned so much by coming along to PyData over the last few years and I know I’m not alone in that. The UK PyData community is an amazing resource that we’re lucky to have but it only exists because of the time and effort our community invests in it, especially the awesome organisers of these groups, some of whom I’ve been lucky enough to meet at the PyData London conference organisers lunch over the years.
If you take one thing away from this blog: if your local PyData group hasn’t hosted an event in 100 days, please consider supporting them either through volunteering, speaking, sponsoring, or otherwise participating in building this awesome community. If you aren’t inspired by maps to seek out regional PyData communities, I’m sure meeting the organisers of these groups would, they’re great people!
Watch this space for updates on my journey to as many UK PyData meetups who will have me. If you’re an organiser and you’d like me to speak, give me a shout!